What happened to summer? School is full swing back in session and kids are back on the school bus, commuting to and from school.
Legally, school bus companies are held to higher standards of care because we entrust our children to the care and custody of those companies and we have a right to demand that these carriers act safely and responsibly when carrying our children.
Even though school busses are statistically considered one of the safest and best choice(s) to transport children to and from school an average of 135 people die per year in school transportation related crashes. 17 of those deaths are school-age children.
Victims of school bus accidents include occupants of the school bus or school transportation vehicle, pedestrians, occupants of other vehicles or bicycles, skateboards, wheelchairs or other forms of mobility. Injuries can result from getting on or off the bus or from an actual crash, and in the worst case, result in death.
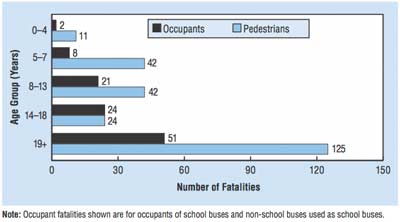
In the ten-year period of 2003 to 2012, 174 school-age children died in school-transportation- related crashes, 55 were occupants of school transportation vehicles and 119 were pedestrians. (1)
Total School Bus Occupant and Pedestrian Fatalities in School-Transportation-Related Crashes by Age Group, 2003–2012 (1)

Time of Day of School Bus and School Transportation Vehicle Accidents
Statistics indicate we should drive with extra caution between the 7:00-7:59 am and 3:00-3:59 pm during the school year. The most fatalities in school bus and school transportation vehicle related accidents occur during those times accounting for 80, or 46% of all fatalities for school-age children and 88, or 52% of people 19 years of age and older.
The hour before and after these two hours account for up to 40% additional fatalities of school-age children and up to 34% of people 19 years of age and older. (2)
Information from the NHTSA and The American School Bus Council indicates that during normal school travel hours, traveling by school bus accounts for only 1% of student fatalities. Traveling by teen drivers results in 58% of student fatalities, while traveling by adult driver results in 23%. (3)
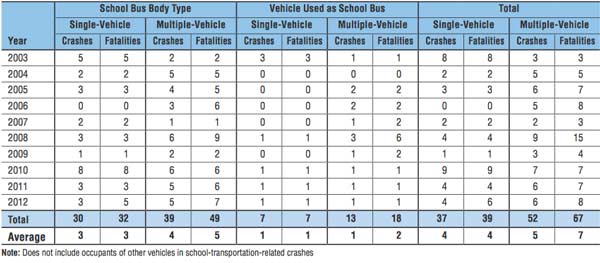
Fatalities of All Ages in School Transportation Related Crashes 2003-2012(1)

The table above shows that in the decade covered by this report, 46 drivers and 60 passengers were killed in school bus vehicles. On average that is 5 drivers and 6 passengers per year. Among the 244 pedestrians that were killed, school vehicles struck 80% or195 pedestrians and other vehicles struck 20%. However, the largest numbers of fatalities by category were 962 occupants of other non-school bus transportation vehicles.
School busses are designed to keep children safe. That is not enough. School bus companies need to hire competent drivers, need to prepare safe routes to schools and need to exercise care and caution.
All drivers, not just school bus and school transportation vehicle drivers, must drive carefully on or in the presence of school busses. This is especially important during school hours.
In ten years between 2003 and 2012 174 school age children died, and 1,179 non school-age people died. We all need to concern ourselves with the safety of those commuting to and from school for the sake of school children and others involved in those accidents.
Sources:
(1) Source Article: http://www-nrd.nhtsa.dot.gov/Pubs/811890.pdf
(2) Note: The statistics for the hour before 7 am indicate the time period of Midnight to 6:59 am. An assumption was made that the majority of those fatalities occurred between 6 and 6:59 am.
(3) http://www.schoolbusfacts.com
Learn more about School Buses:
Information on School Buses from the National Highway Traffic Safety (NHTSA)
http://www.nhtsa.gov/School-Buses
Learn more about victims of school bus accidents: https://www.dillerlaw.com/school-bus-accidents.html
Photo source:
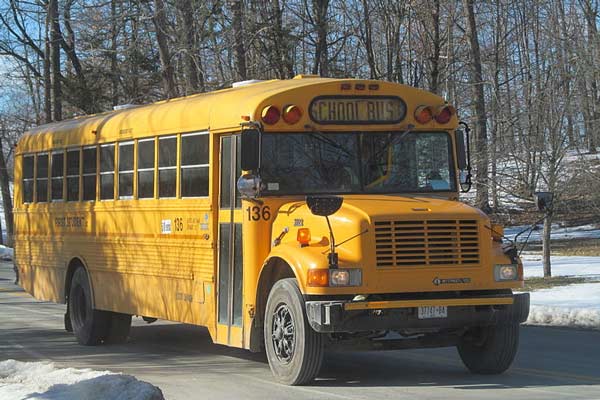
School Bus Photo: By Die4kids (Own work) [GFDL (http://www.gnu.org/copyleft/fdl.html) or CC-BY-SA-3.0 (http://creativecommons.org/licenses/by-sa/3.0)], via Wikimedia Commons

